


Ep. 227 – Market Update September 23 – Eighth consecutive month of national growth, and consumer sentiment has ticked up
Ep. 227 – Market Update September 23 – Eighth consecutive month of national growth, and consumer sentiment has ticked up
1.02 – A surprise little announcement!
9.55 – Is there a sweet spot ratio when it comes to listing volumes and price movement? Tune in to find out.
12.45 – Rents are changing, and it could be due to a structural change.
17.30 – Cate adds some perspective to the rental challenges our nation is still facing
21.23 – Mike chats with Cate about the data she has shared on Perth in a recent Core Logic release on rents.
26.48 – Teaser from next week’s episode
38.17 – Consumer sentiment… are we seeing green shoots?
46.54 – Gold nuggets!
The September data throws us a few mixed bag items! Dave shares his takeaway: listing levels and an interesting correlation.
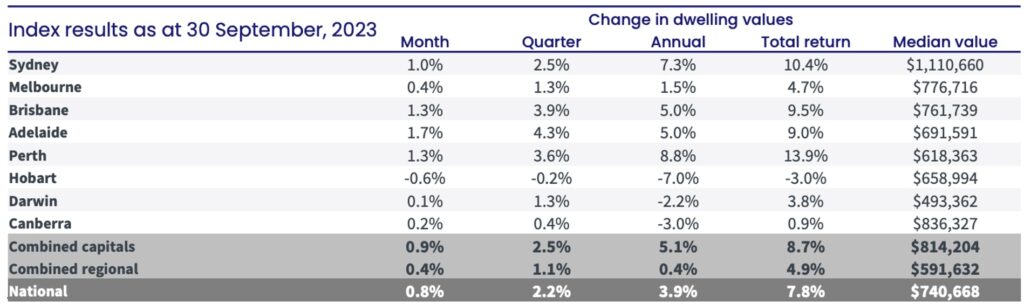
Cate identifies the eighth consecutive month of national price growth, and she draws listener attention to capital cities versus the regions. The Trio ponder the power of commuting distance to major cities.
Is there a sweet spot ratio when it comes to listing volumes and price movement? Mike ponders… tune in to find out.
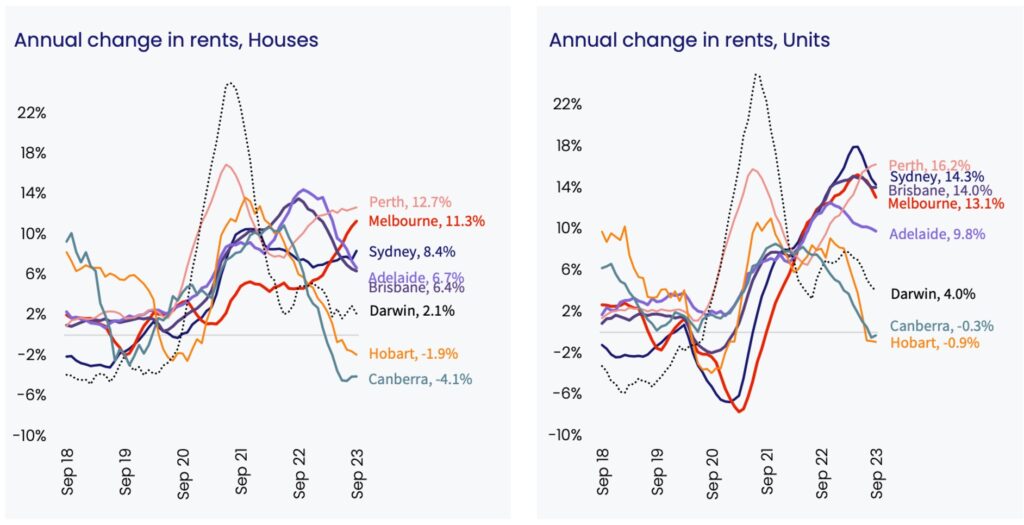
What’s happening with rents? And why is the pace of growth easing in so many cities? Household formation rates are changing and this is having an impact on rental growth. Cate shares a bit of insight into a recent journalist interview about this very topic. She also talks about the specific challenges within the rental market when it comes to families.
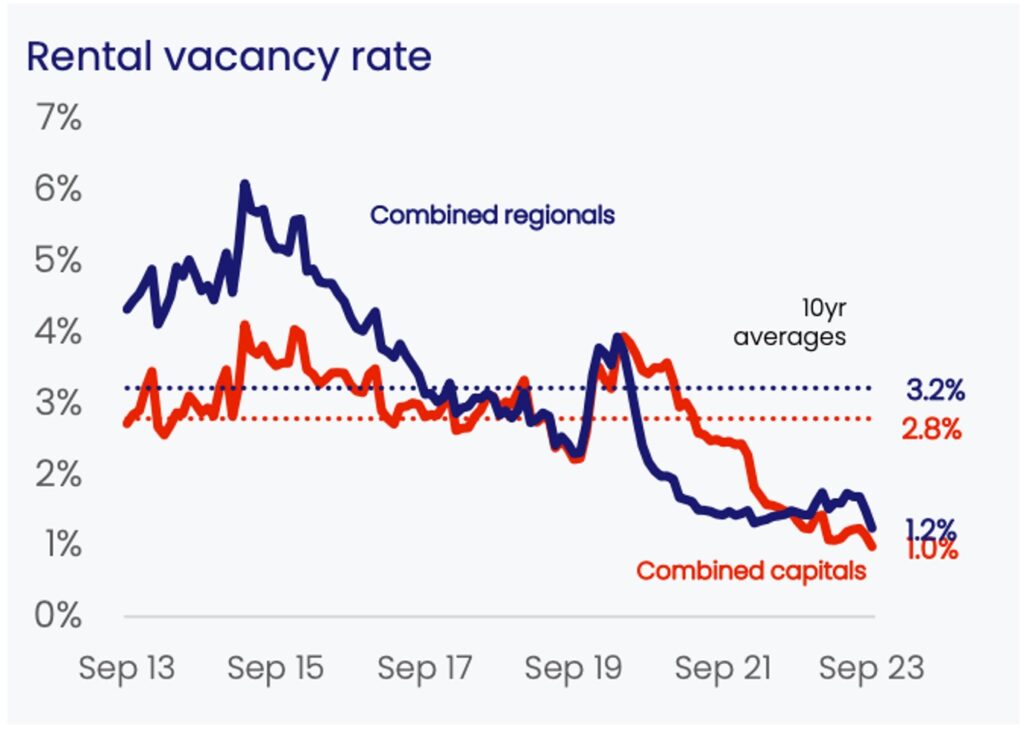
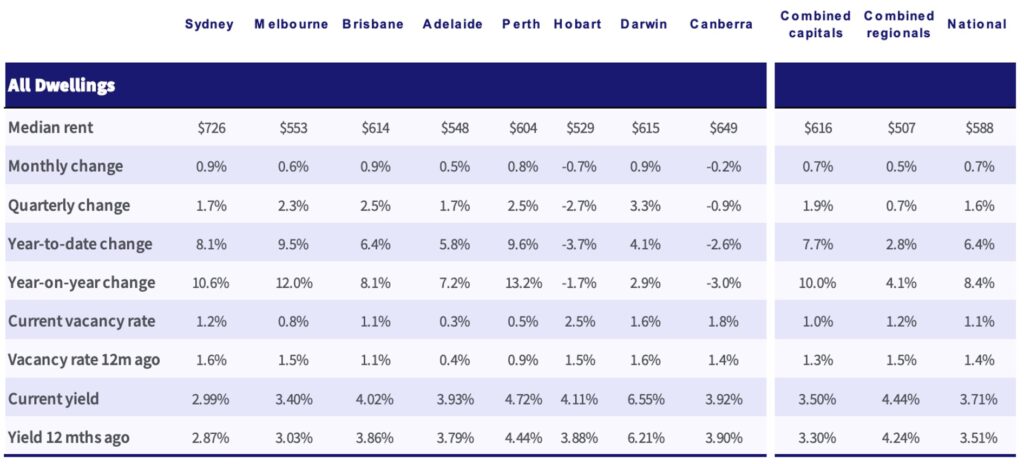
On a related topic, Dave points out the pre-COVID, post-COVID and historical average rental vacancy rates and it’s a particularly telling reflection. The Trio canvas the pace of this change and contrast today’s yields to past decades. Things have evolved remarkably for investors over the past decade.
“Time is your most powerful ingredient when it comes to yield”, says Cate.
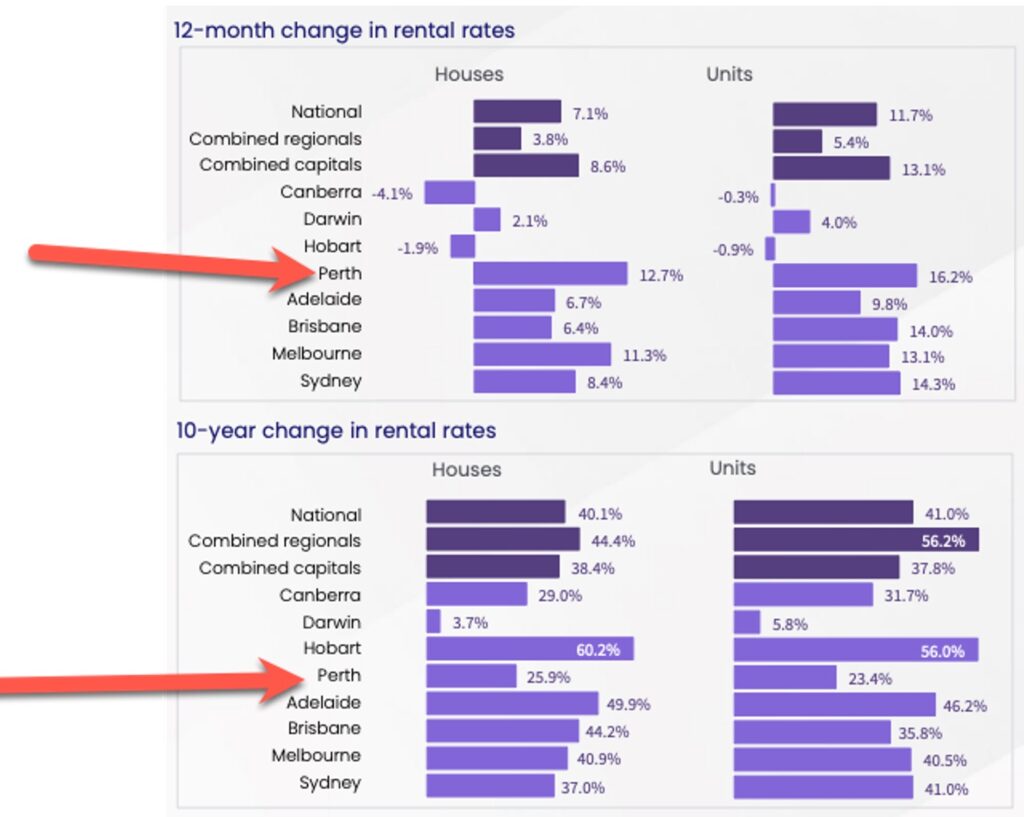
Cate shares this chart with Mike and Dave; it illustrates the importance of looking longer term at any city’s performance. Both Perth and Hobart demonstrate opposing performances when 12 month versus ten year charts are contrasted.
Some cities and regions are particularly cyclic and investors need to be aware of this.
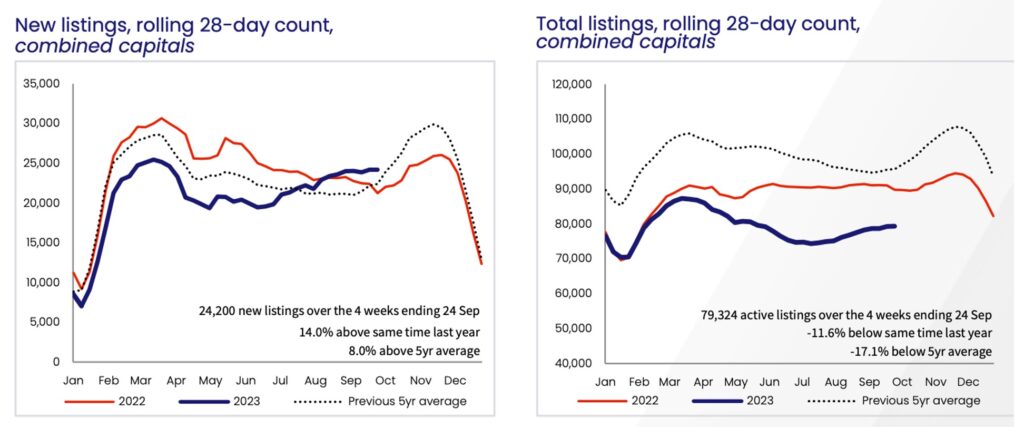
Mike asks Cate for an explanation for heightened new listing activity, but despite increased new listings, our total listing numbers are still significantly under the five year average. This signals buyer demand is particularly strong.
“We’re eroding our total stock volumes because we have much greater demand.”
Dave weighs in on some of the reasons he believes are driving our listings and sales figures.
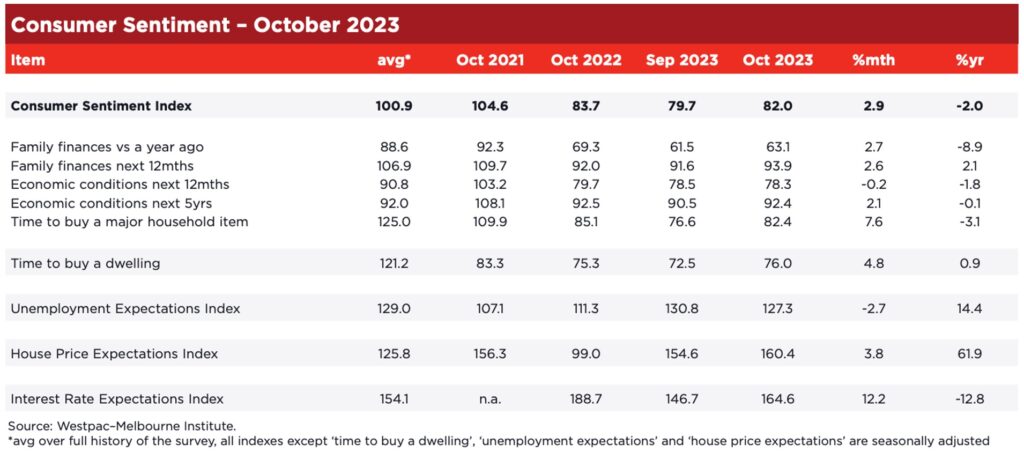
And finally, consumer sentiment; as Mike says “there’s green shoots!” The major household item figures have notched back up above last month’s dip. Have four consecutive months of holding rates contributed to a greater willingness to spend again? Dave has some great state-based figures to cite also.
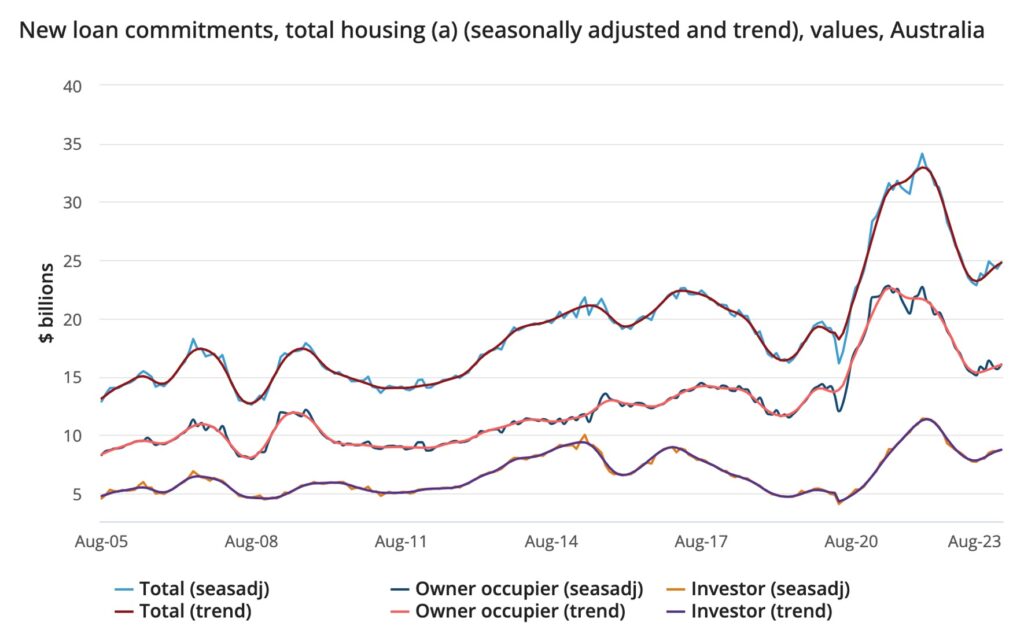
Housing finance is an interesting chart to ponder. Mike and Dave debate the impact of rates on hold, and Dave points out that the mix of owner occupiers to investors remains quite the same as recent historical levels. Importantly, he points out reductions in building costs.
Related to decreasing costs, Cate includes the Freightos Baltic index in this monthly update.
Dave and Cate pick out some of their most noteworthy segments from the September data… Listen in to hear what each spotted. Dave notes core inflation was down, yet headline inflation increased. This suggests that the markets could be anticipating another rate rise. What is this attributable to? Services, insurances and transport are among a few. Services inflation remains an inflationary problem.
And… time for our gold nuggets…
Cate Bakos’s gold nugget: Cate shares context around the Freightos Baltic index; a whopping 62% reduction this week, compared to the same week a year ago.
Dave Johnston’s gold nugget: We’re likely to hit our record market high again within a month or so based on the data and the rate of growth through 2023.
Resources:
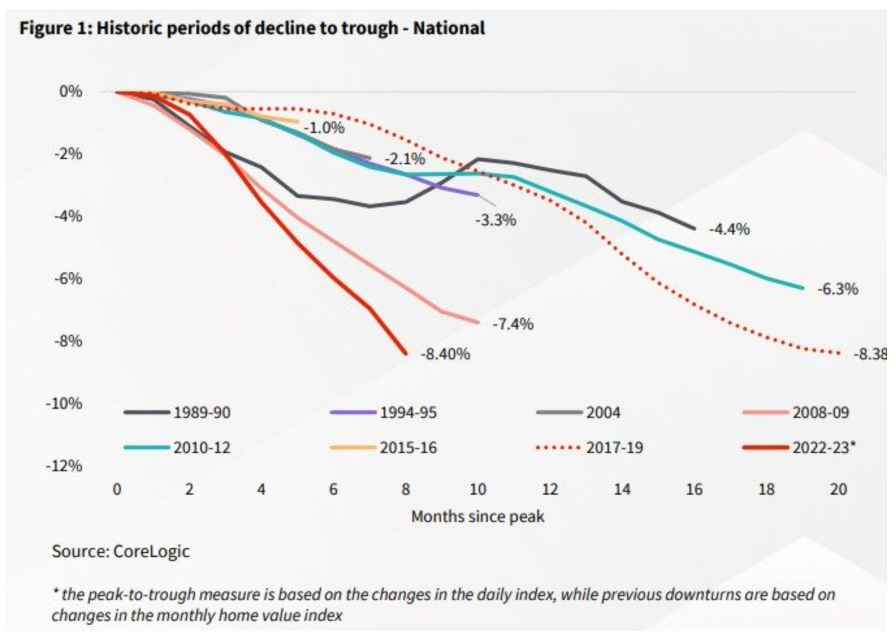
Cate talked about the following price falls chart:
If you’ve enjoyed this show, take a listen to these eps:
Ep. 4 – How to develop your own property plan
Ep. 9 – why mortgage strategy is more important than your interest rate
Ep. 19 – time in the market vs timing the market
Ep. 52 – Dissecting 10 years of Core Logic data – capital cities & regional areas
Eps. 217, 219, 220 – And check out our inflation and interest rates trilogy