


Ep. 388: Market Update Oct 2026 – Seventh Straight Monthly Fall, Only Victoria’s Buyer Sentiment is Positive & Rental Yields at 11-Year High
Ep. 388: Market Update Oct 2026 – Seventh Straight Monthly Fall, Only Victoria’s Buyer Sentiment is Positive & Rental Yields at 11-Year High
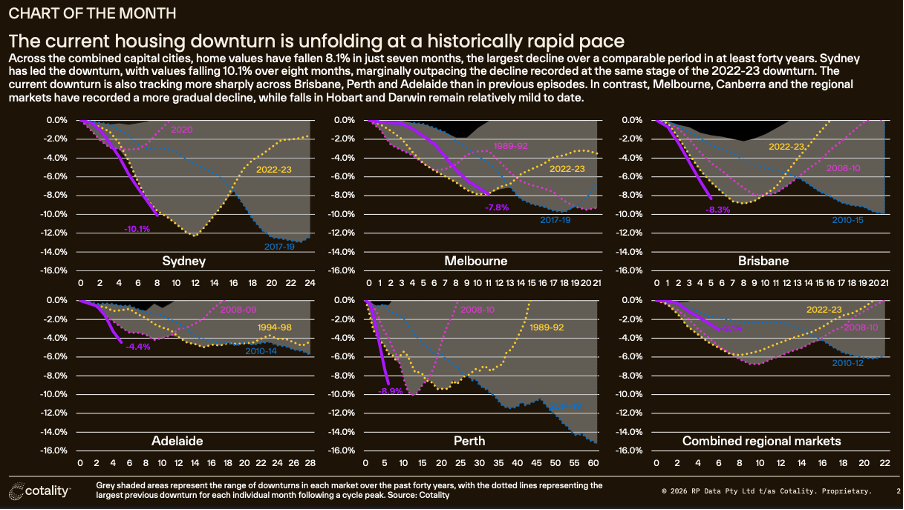
🎧 Mike, Cate and Dave are back for this month’s market update. They unpack the October figures and look at what’s driving the fastest pace of decline Cotality has recorded in forty years.
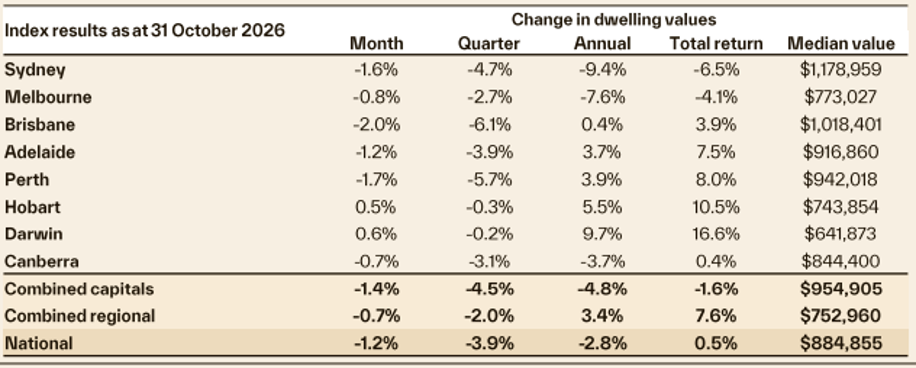
Hobart and Darwin recorded slight gains while every other capital fell, with Brisbane down 2% and Perth down 1.7%. Dave walks through house medians: Canberra ($983,000) and Perth ($982,000) have now joined Adelaide below the million dollar mark, and Melbourne sits at $906,000. Cate explains why Hobart’s headline median, just $30,000 under Melbourne’s, is misleading. Dave’s unit mix figures (18% of Hobart’s properties are units, against 33% in Melbourne) show how different the two cities really are.
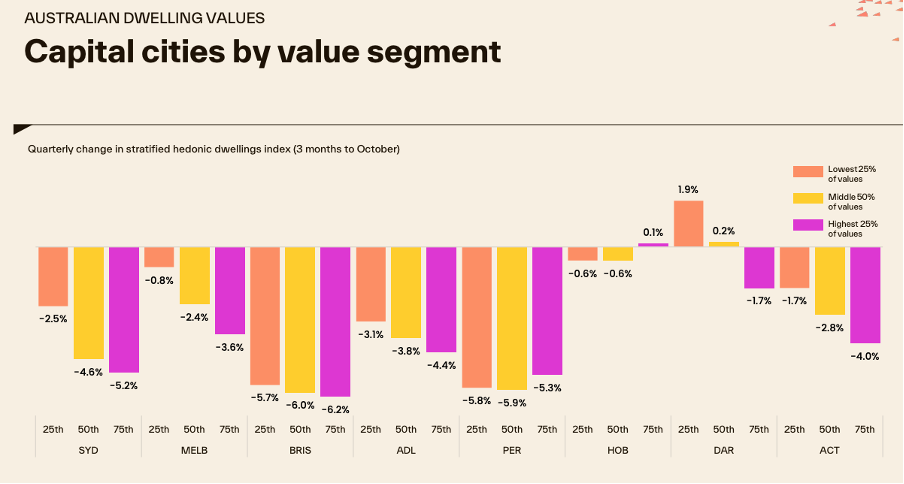
📊 The trio digs into price segments. In most capitals the bottom quartile is holding up best, and Darwin’s lower quartile is still growing at 1.9%. Will that growth hold, or is it simply a lag?
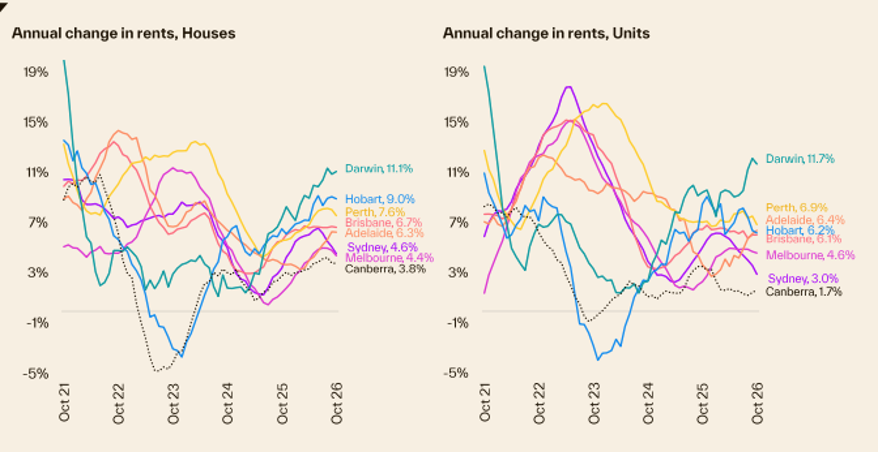
Rents are still rising, though more slowly. Cate shares PropTrack search data showing growing interest in dual living, self contained homes and granny flats as renters change the way they live. Yields are at their highest since May 2015, but Dave notes that a neutrally geared purchase would need a yield closer to 7%. Could rising yields eventually draw investors back?
Cate explains what new, total and old listings each reveal. Dave flags Adelaide’s 18% jump in new listings as vendors look to cash out after a big run. Distressed listings are up in every state.
Consumer sentiment shows a striking divide: Victoria is the only state where more people think it’s a good time to buy than a bad one. Mike and Dave also weigh up the RBA rate tracker, which points to a fifty fifty chance of another rise.
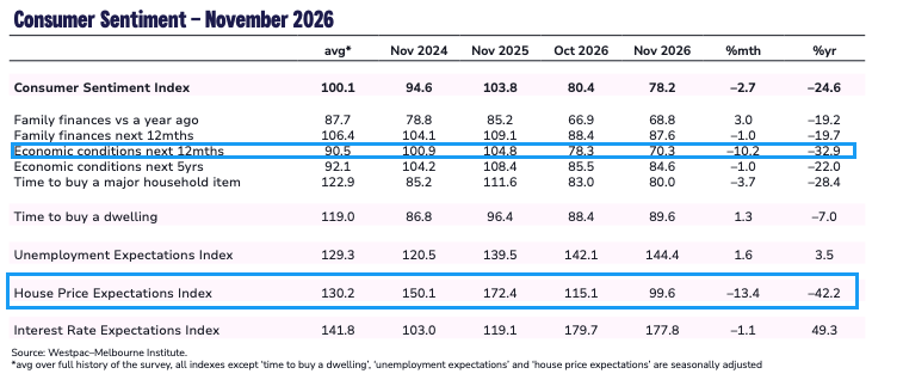
From medians and rents to listings, sentiment and rates, this episode leaves one big question hanging: what will spark the next upswing when it comes?
Bonus chart:
Resources:
o 361: Are Government Property Incentives Helping Buyers or Heating the Market?
Upcoming episode – #389: Granny Flats, Rooming Houses & Cheaper Regional Dwellings, Smart Strategy or Risky Trend?
Charts sourced from Core Logic and Westpac