


Ep. 366: Market Update May 2026 – Flat National Growth Masks Big City Moves, Budget Nerves Build & Rents Keep Rising
Ep. 366: Market Update May 2026 – Flat National Growth Masks Big City Moves, Budget Nerves Build & Rents Keep Rising
🎧 May delivered one of the most intriguing market updates we’ve seen in some time.
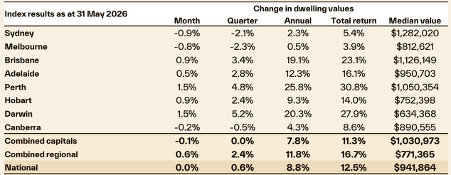
While the national headline figure suggested little movement overall, the story beneath the surface was anything but flat. Some of Australia’s strongest-performing markets continued their impressive run, while Melbourne and Sydney experienced notable monthly declines, highlighting just how fragmented our property landscape has become.
In this episode, Cate and Mike unpack the latest data and discuss what they’re seeing on the ground. From softer auction conditions and changing buyer behaviour to investor uncertainty following the Federal Budget announcements, there’s plenty for property buyers to consider.
The conversation explores the immediate market reaction to proposed changes affecting investors and examines what these reforms could mean for established property, new construction, rental supply and long-term affordability. Cate shares her observations from Melbourne’s market, where quality family homes remain highly sought after, while other segments are experiencing far less competition.
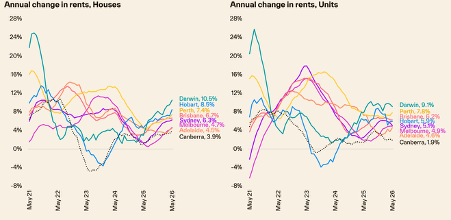
Mike and Cate also take a deep dive into rental growth, gross yields, listings activity and consumer sentiment. They discuss why rents continue to rise despite affordability pressures, what housing supply data is revealing, and whether some markets are approaching turning points after several years of extraordinary growth.
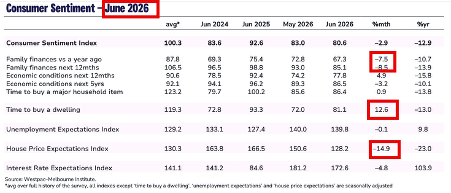
The broader economy also comes under the microscope, with discussion around inflation, wage growth, household savings, interest rate expectations and construction costs. Together, these factors help paint a clearer picture of the forces shaping Australia’s property market today. The latest Westpac Consumer Sentiment Index points out a significant change for the House Price Expectations Index, clearly signalling that consumers anticipate house prices to decline. However, the Time to Buy a Dwelling index shifted 12.6%, suggesting that consumers increasingly feel the time to buy is now.
As always, the focus is on helping listeners cut through the noise and understand what the data is really telling us.
🏠 Tune in to hear more!…
Resources:
Ep. 361: Are Government Property Incentives Helping Buyers or Heating the Market?
Upcoming ep: #367 – The limitations of using Land to Asset Ratio as a determinant of capital growth potential, and the other measures that are also vitally important
Charts sourced from Core Logic and Westpac