

Ep. 308: Darwin Under the Microscope – Resources
Ep. 308: Darwin Under the Microscope – Resources
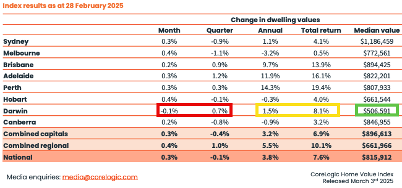
Median Values – Corelogic
Median values – ALL DWELLINGS
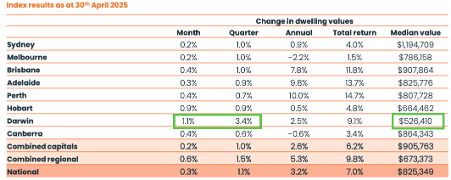
· National – $825,349
· Combined capitals – $905,763
· Combined regional – $673,373
· Capitals –
o Sydney – $1,194,709
o Brisbane – $907,864
o Canberra – $864,343
o Adelaide – $825,776
o Perth – $807,728
o Melbourne – $786,158
o Hobart – $664,462
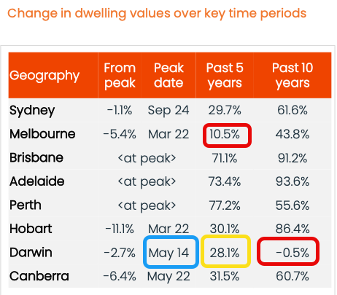
o Darwin – $526,410
Median values – HOUSES
· National – $892,136
· Combined capitals – $1,019,840
· Combined regional – $688,773
· Capitals –
o Sydney – $1,474,343
o Brisbane – $989,818
o Canberra – $977,737
o Melbourne – $934,500
o Adelaide – $876,714
o Perth – $842,413
o Hobart – $707,506
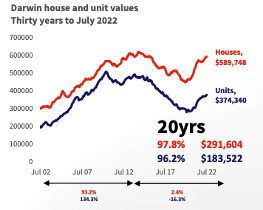
o Darwin – $607,663
Median values – UNITS
· National – $675,331
· Combined capitals – $691,855
· Combined regional – $590,053
· Capitals –
o Sydney – $854,968
o Brisbane – $698,479
o Melbourne – $610,327
o Perth – $600,237
o Adelaide – $595,515
o Canberra – $594,602
o Hobart – $530,640
o Darwin – $373,213
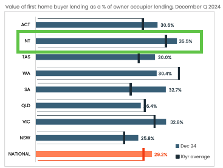
Asking Prices – SQM

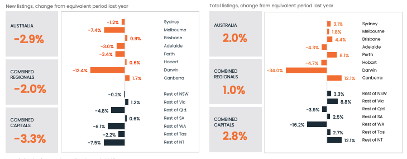
Listings – monthly change Feb to March vs last year – SQM
| New Listings | February | March | % change |
| 2025 | 258 | 354 | 37.2 |
| 2024 | 289 | 244 | -15.6 |
| Total Listings | February | March | % change |
| 2025 | 1109 | 1126 | 1.5 |
| 2024 | 1517 | 1577 | 4.0 |
| Old listings | February | March | % change |
| 2025 | 514 | 394 | -23.3 |
| 2024 | 615 | 647 | 5.2 |
Sales volumes – CoreLogic

Median Days on Market – CoreLogic

NT vs WA Mining
| Mineral / Resource | Western Australia (WA) | Northern Territory (NT) |
| Iron Ore | ✅ | ❌ |
| Gold | ✅ | ✅ (smaller scale) |
| Uranium | ❌ | ❌ (not anymore) |
| Manganese | 🔸 (small deposits) | ✅ (Groote Eylandt) |
| Bauxite | ✅ | ✅ (Gove Peninsula) |
| Nickel | ✅ | ❌ |
| Lithium | ✅ (world leader) | 🔸 (early-stage exploration) |
| Rare Earths | ✅ (e.g., Mt Weld) | ✅ (e.g., Nolans project) |
| Natural Gas (LNG) | ✅ | ✅ (Ichthys LNG) |
| Copper | ✅ | 🔸 (limited exploration) |
| Zinc/Lead/Silver | ✅ | ✅ (McArthur River area) |
| Coal | ✅ | ❌ |
| Vanadium | 🔸 (some projects) | ✅ (e.g., Mount Peake) |
| Cobalt | ✅ (byproduct of nickel) | 🔸 (exploration) |
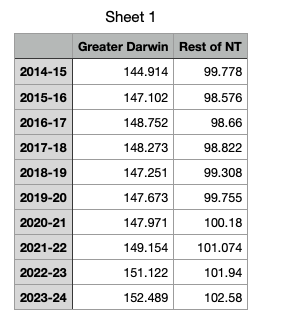
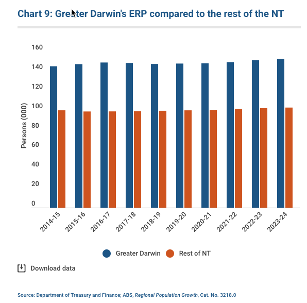
ABS population estimates – for June 2024
| Rank | City | State/Territory | Population |
| 1 | Greater Sydney | New South Wales | 5,557,233 |
| 2 | Greater Melbourne | Victoria | 5,350,705 |
| 3 | Greater Brisbane | Queensland | 2,780,063 |
| 4 | Greater Perth | Western Australia | 2,384,371 |
| 5 | Greater Adelaide | South Australia | 1,469,163 |
| 6 | Gold Coast–Tweed Heads | Queensland/New South Wales | 750,997 |
| 7 | Newcastle–Maitland | New South Wales | 534,033 |
| 8 | Canberra–Queanbeyan | Australian Capital Territory/New South Wales | 510,641 |
| 9 | Sunshine Coast | Queensland | 417,982 |
| 10 | Central Coast | New South Wales | 351,237 |
| 11 | Wollongong | New South Wales | 318,258 |
| 12 | Geelong | Victoria | 308,915 |
| 13 | Greater Hobart | Tasmania | 254,930 |
| 14 | Townsville | Queensland | 189,356 |
| 15 | Toowoomba | Queensland | 173,204 |
| 16 | Cairns | Queensland | 163,214 |
| 17 | Greater Darwin | Northern Territory | 152,489 |
| 18 | Ballarat | Victoria | 119,284 |
| 19 | Bendigo | Victoria | 106,022 |
| 20 | Albury–Wodonga | New South Wales/Victoria | 101,370 |
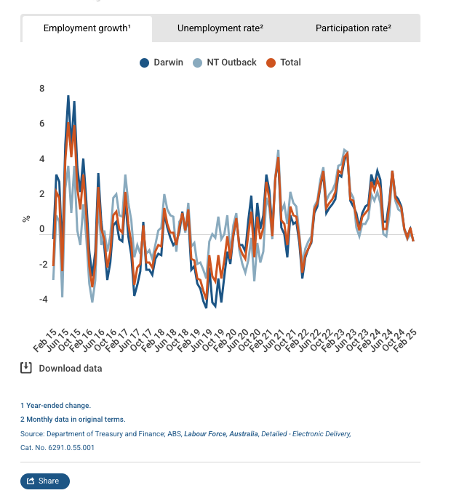
Employment Growth – Darwin – ABS / Department of Treasury and Finance

Employment Growth – State Comparison – ABS / Department of Treasury and Finance

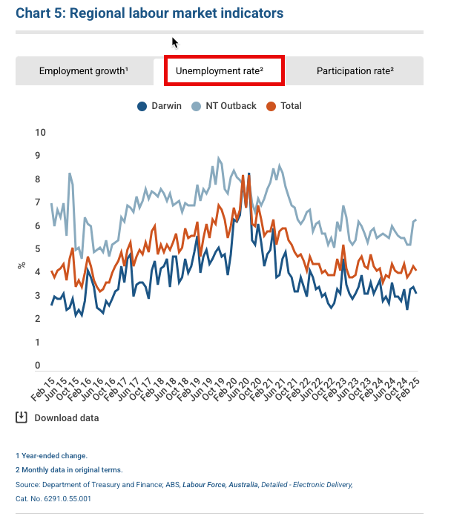
Unemployment rate – NT vs Aus – ABS / Department of Treasury and Finance

Unemployment rate – State comparison – ABS / Department of Treasury and Finance

Unemployment rate – Darwin – ABS / Department of Treasury and Finance

Wages growth – ABS

GDP vs Population – ABS
| City | GSP (AUD million) | % of Australia’s GDP | Population (June 2024) | % of Australia’s Population |
| Darwin | $13,429 | 0.51% | 152,489 | 0.56% |
| State/Territory | GSP (AUD million) | % of Australia’s GDP | Population (June 2024) | % of Australia’s Population |
| New South Wales (NSW) | $788,608 | 30.30% | 8,339,300 | 30.50% |
| Victoria (VIC) | $580,918 | 22.30% | 6,812,500 | 24.90% |
| Queensland (QLD) | $515,895 | 19.80% | 5,459,400 | 20.00% |
| Western Australia (WA) | $448,207 | 17.20% | 2,878,600 | 10.50% |
| South Australia (SA) | $142,175 | 5.50% | 1,851,700 | 6.80% |
| Australian Capital Territory (ACT) | $53,253 | 2.00% | 466,800 | 1.70% |
| Tasmania (TAS) | $40,620 | 1.60% | 572,800 | 2.10% |
| Northern Territory (NT) | $34,581 | 1.30% | 252,500 | 0.90% |
| Total Australia | $2,604,257 | 100% | 27,309,396 | 100% |
Public Sector employment – ABS
| Territory | Total Public Sector Employees (June 2024) | Total Labour Force (June 2024) | Public Sector Employment (%) |
| New South Wales (NSW) | 707,600 | 4,500,000 | 15.70% |
| Victoria (VIC) | 606,200 | 3,900,000 | 15.50% |
| Queensland (QLD) | 506,900 | 2,800,000 | 18.10% |
| South Australia (SA) | 176,100 | 900,000 | 19.60% |
| Western Australia (WA) | 264,300 | 1,400,000 | 18.90% |
| Tasmania (TAS) | 65,400 | 300,000 | 21.80% |
| Northern Territory (NT) | 44,100 | 150,000 | 29.40% |
| Australian Capital Territory (ACT) | 147,400 | 230,000 | 64.10% |
Federal budget $ allocation vs Population – funding to population ratio
| State/Territory | Total Payments ($B) | % of Federal Budget | Population | % of Population | Funding-to-Population Ratio |
| New South Wales (NSW) | 52.75 | 6.71% | 8,511.2 | 31.17% | 0.22 |
| Victoria (VIC) | 44.25 | 5.63% | 7,013.0 | 25.68% | 0.23 |
| Queensland (QLD) | 38.76 | 4.93% | 5,608.7 | 20.54% | 0.25 |
| Western Australia (WA) | 19.76 | 2.51% | 2,981.8 | 10.92% | 0.24 |
| South Australia (SA) | 16.18 | 2.06% | 1,882.7 | 6.89% | 0.3 |
| Tasmania (TAS) | 5.78 | 0.74% | 576.0 | 2.11% | 0.35 |
| Australian Capital Territory (ACT) | 3.43 | 0.44% | 475.6 | 1.74% | 0.26 |
| Northern Territory (NT) | 6.6 | 0.84% | 255.6 | 0.94% | 0.93 |
| Australia (Total) | 187.93 | 23.90% | 27,309.4 | 100% | 1 |