

Episode 217: Resources
Episode 217: Resources
If you enjoyed this episode, you may also enjoy these:
Ep. 10 – Why your approach and assessment of risk is paramount to your property success!
Ep. 35 – Emotional decision-making: #5 of the top seven critical mistakes
Ep. 155 – Plotting Australian property market movements from 1970 to now
Ep. 158 – How interest rate cycles have impacted the property market since 1990
Comprehensive show notes plus charts
What is it, why is it a problem and what causes it explained?
1. What is Inflation?
Explanation
Inflation refers to the general increase in prices of goods and services in an economy over a specific period of time.
- It is typically measured by calculating the percentage change in a price index, such as the Consumer Price Index (CPI), which tracks the average price level of a basket of goods and services consumed by households.
- When inflation occurs, the purchasing power of money decreases because it takes more money (units of currency) to buy the same goods and services.
- In other words, your money’s value decreases as prices rise.
- This can affect various aspects of the economy and individuals’ finances, which we will cover in the Negative impacts of inflation.
Inflation is also known as the CPI, short for the Consumer Price Index, because this is the index that records the changes in pricing of all the goods and services (most of them actually) in the economy.
So, if someone says CPI they are referring to the rate of Inflation.
Key numbers on the history of Oz inflation
Since 1990, annual inflation in Australia has averaged close to 2.5 per cent, meaning the average cost of what households buy has increased by about 2.5 per cent each year. This is within the Reserve Bank of Australia’s (RBAs) target range of 2-3%. The RBA is headed, (but perhaps for not much longer) by Governor Phillip Lowe, who ultimately decides along with his board whether you pay higher, lower or the same interest rates each month. Actually, they currently meet every month except for January, and next year plan to meet only 8 times per year.
- After almost six years of low inflation, underlying price pressures started to intensify midway through 2021 after the mother of all government spending sprees took place during 2020 and into 2021, to offset the lack of work and productivity undertaken due to lockdowns and the fear of the spread of Covid around the world. Our Inflation has risen as follows.
- June 21 – 3.8%
- Sept 21 – 3.0%
- Dec 21 – 3.5%
- Mar 22 – 5.1%
- June 22 – 6.1%
- Sept 22 – 7.3%
- Dec 22 – 7.8%
- Mar 23 – 7%
For context this is what inflation looked like on average, before we began the rise in 2021
- 2017 – 1.9%
- 2018 – 1.8%
- 2019 – 1.8%
- 2020 – 0.7%
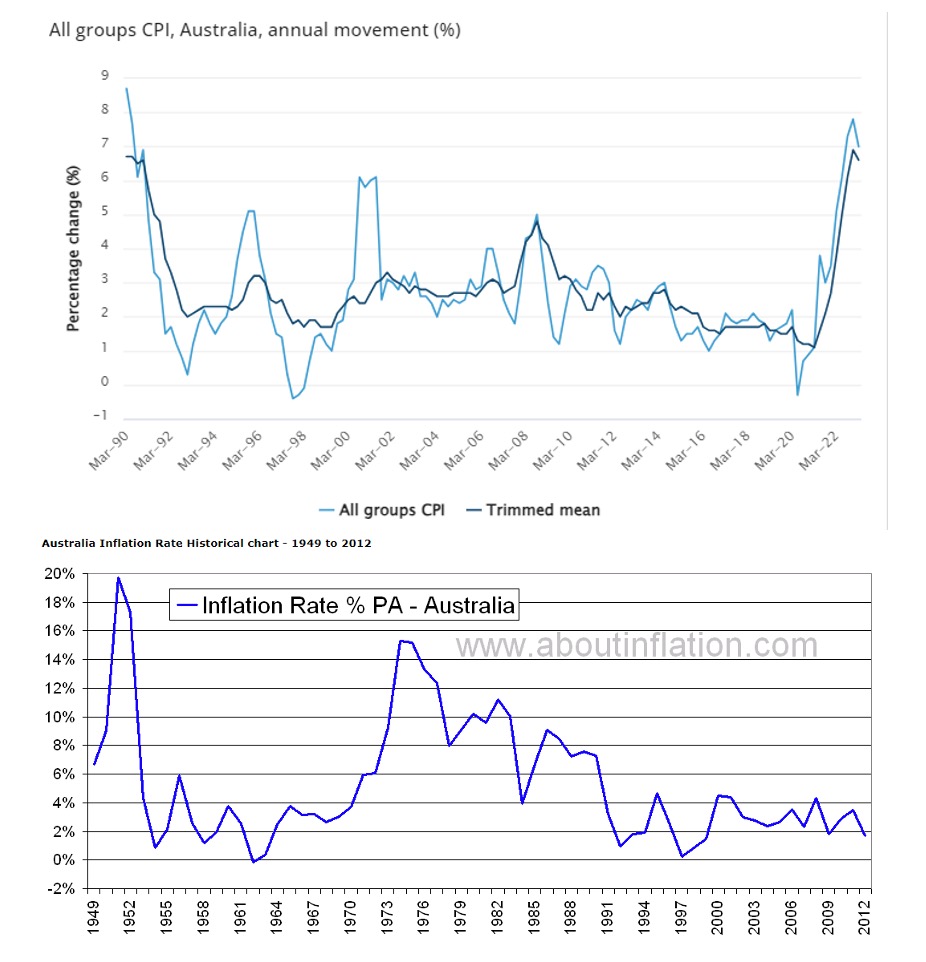
We have in front of us a graph of Oz inflation dating back to 1990 which we will share with you and it shows how inflation had been gradually declining since the bump leading into the Global Financial Crisis in 2008. In fact, prior to this spate of inflation, low inflation was a major concern for government and part of the reason why interest rates had been going so low around the world and reserve banks had also resorted to quantitative easing (or money printing as it is colloquially known) prior to this recent space of inflation. It also probably played a part along with other factors in causing many governments and reserve banks to over stimulate during the Covid fear, however, we must admit it was a once in a hundred years event (fingers crossed that remains one in a hundred years or less moving forward also).
Some Previous peaks of inflation in Australia include –
September 2000 and June 2001 – 6.1% annual inflation
What caused this spike are some great examples of what can concern the RBA during the current spike in Inflation?
- Commodity Price Increases: Australia is a major exporter of commodities, including minerals and agricultural products. In the early 2000s, there was a significant increase in global commodity prices, driven by strong demand from emerging economies such as China. This increase in commodity prices led to higher input costs for Australian businesses, which eventually translated into higher consumer prices and contributed to inflationary pressures.
- Housing Market Boom: During the early 2000s, Australia experienced a housing market boom, particularly in major cities like Sydney and Melbourne. The surge in housing demand, fueled by low interest rates and increased investor activity, led to higher property prices and rents. The rising cost of housing, which is a significant component of the consumer price index, contributed to inflationary pressures.
- Strong Economic Growth: Australia had a period of robust economic growth during the early 2000s, driven by factors such as high commodity prices, increased government spending, and a growing services sector. Strong economic growth can lead to increased consumer spending and investment, which can put upward pressure on prices and contribute to inflation.
- Exchange Rate Movements: Currency movements can influence the price of imported goods and services. In the early 2000s, the Australian dollar depreciated against major currencies, making imports more expensive. This depreciation contributed to higher prices for imported goods and added to inflationary pressures.
- Wage Growth: Wage growth can also contribute to inflation. During the early 2000s, there was a period of relatively strong wage growth in Australia, partly driven by the tight labor market and skill shortages in certain industries. Rising wages can lead to increased production costs for businesses, which can be passed on to consumers through higher prices.
September 2008 – 5.0% annual inflation
- Rising Commodity Prices: Similar to the early 2000s, global commodity prices were on the rise in 2008.
- Strong Domestic Demand: Australia was experiencing a period of strong domestic demand in 2008, driven by factors such as low unemployment, increased government spending, and buoyant consumer confidence. This robust demand increased pressure on resources and labor, leading to higher wages and production costs.
- Global Food Price Increases: In 2008, there was a global surge in food prices due to factors such as adverse weather conditions, increased demand, and changes in agricultural practices. Australia, being a major exporter of agricultural products, was affected by the rise in global food prices. The higher costs of food production and transportation were passed on to consumers, contributing to inflationary pressures.
- Exchange Rate Movements: In 2008, the Australian dollar experienced significant volatility. At times, it appreciated against major currencies, reducing the cost of imported goods. However, during certain periods, it depreciated, increasing the prices of imported goods and contributing to inflation.
- Global Financial Crisis: The global financial crisis, which originated in the United States in 2007-2008, had spill-over effects on Australia’s economy. The crisis led to a significant downturn in global economic activity and financial market turmoil. In response, the Australian government implemented fiscal stimulus measures, such as increased public spending and tax cuts, to mitigate the impact of the crisis. These measures increased government expenditure, which can potentially fuel inflationary pressures.
Notice a pattern!
A lot of similarities each time we have struck inflation issues…..
2. What is the RBA inflation target and why?
- Australia’s inflation target is to keep annual consumer price inflation between 2 and 3 per cent, on average, over time.
- This target is often considered low enough to avoid deflationary pressures and maintain price stability while allowing for some flexibility in economic growth.
- The target is often seen as striking a balance between encouraging moderate price increases and preventing the erosion of purchasing power.
3. Why is inflation occurring?
Well, many of the factors that caused the last two bursts of inflation are happening again.
History may not repeat, but is sure does rhyme!
After almost six years of low inflation, underlying price pressures started to intensify midway through 2021.
In General – Inflation can be caused by several factors, including these four key ways which we will place in the order of which they have occurred in current times:
- Monetary Inflation: When there is an increase in the money supply in the economy, it can lead to inflation if the production of goods and services does not keep pace with the increased money supply. This is often influenced by central banks and their monetary policies.
“Covid times this has been the massive government stimulus to infinity, money printing and reducing rates to zero or below.”
- Cost-Push Inflation: This happens when the cost of production, such as wages or raw materials, rises and businesses pass on those increased costs to consumers in the form of higher prices.
“Covid times this was the breakdown of supply chains due to closed borders, the lack of availability of workers and reduction in trust between many western countries and China in particular, then the Russian invasion of Ukraine all pushing up the costs of supply.
The prices of goods increased strongly as retailers pass through the costs associated with supply chain disruptions and higher shipping prices which are now starting to subside.
Meanwhile, the cost of building a new house – the largest component of the CPI basket – increased at its fastest rate in more than a decade due to a boom in construction activity (due to government stimulus for building new dwelling and renovations for the first time ever) and record inflation in building material prices.”
- Demand-Pull Inflation: This occurs when the demand for goods and services exceeds the available supply, leading to an increase in prices.
“This happened due to all the stimulus, increased personal savings, growth in property values and desire to travel again and revenge spend that happened in 2022 and into 2023.”
- Expectations: If people anticipate higher future prices, they may adjust their behavior by demanding higher wages or raising prices, thereby contributing to inflation.
“This is the final phase that the reserve bank is very wary of which leads to a wage price spiral, entrenched expectations for prices, especially for services to continue to rise at this faster rate”.
Some other Examples include:
- As unemployment falls, firms are forced to pay higher wages, bolstering consumers’ purchasing power and increasing demand for goods and services.
‘This is why low unemployment current is a strong contributor to wage growth, and therefore inflation. And the harsh reality is that the RBA through raising rates seeks to increase unemployment, which means putting people out of jobs because of the greater devastation inflation caused to all participants in the economy. In fact, Michelle Bullock the deputy governor of the RBA said as much recently on 20th of June in a presentation she did at Australian Industry Group where she admitted that the nation needs the jobless rate to climb to 4.5% (roughly 140,000 people to lose jobs) to get inflation back in line, the economy would be closer to a sustainable balance point
- Prices rise for services and potentially goods in this situation because of increased demand or lack of supply because households want to buy more than was produced at previous prices.
- Because wages are an input cost for businesses, firms also hike prices to consumers to pay for higher wages.
This logic extends to changes in other input costs:
- For example, timber and bricks are important materials for building a new house.
- If the cost of these inputs were to increase, home builders may raise prices.
4. How is inflation measured? And how they are tracking, and why the government is now more concerned about services inflation becoming entrenched why it looks like Goods are coming down?
The CPI is often divided into sub-indices which are –
Goods and Services.
- The goods CPI measures the price changes of physical goods, including items like groceries, clothing, furnishings and household equipment and electronics.
- The services CPI, on the other hand, tracks the price changes of services like healthcare, education, transportation, and housing services (e.g., rent and utilities). Services include market-based activities such as going to the hairdresser or getting takeaway food, as well as government-subsidised costs such as university fees and childcare. Oddly the increase in costs of government subsidised services plays a role here.
Of the 87 items included in the consumer price index, 60 are goods and 27 are services, according to the Australian Bureau of Statistics.
Despite this disparity, Goods only represent 53 per cent of the CPI by expenditure weight, while services are the remaining 47 per cent.
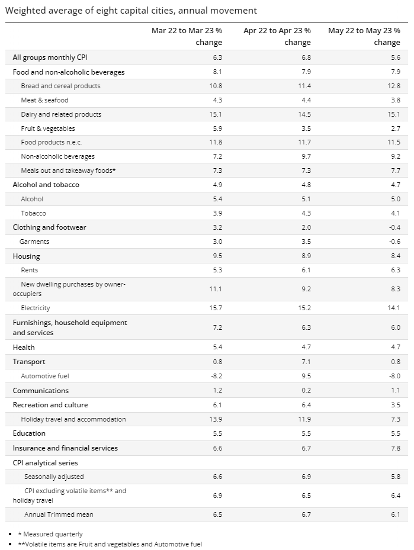
May 23 inflation numbers
The monthly CPI indicator rose 5.6% in the twelve months to May.
Goods Current Numbers
- Goods annual inflation eased after two years of steady increases, from 1.10% in December 2020 up to 9.5 per cent in Dec 22, and how now reduced to 7.6 per cent in March 2023
- Most recently in the May monthly number:
- The most significant price rises were Housing (+8.4%), Food and non-alcoholic beverages (+7.9%) and Furnishings, household equipment and services group (+6.0%).
- Offsetting the rise was Automotive fuel (-8.0%).
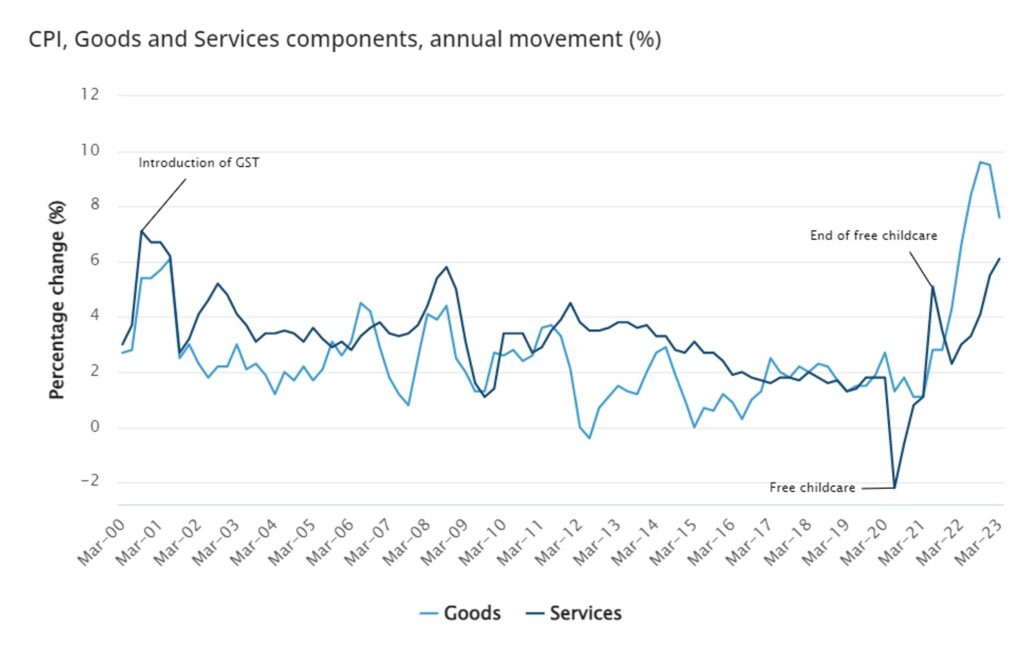
Services – a growing concern
- Services annual inflation has been increasing, from –2.20 per cent in June 2020 up to 5.15% in June 2021 (thanks to free childcare), then dropped to 2.30 per cent in December 2021 at the end of free childcare and has been climbing since up to 6.1 per cent in March 23
- Most recently in the May monthly number:
- International travel – -4.7% over May (but was up 8.6% over April)
- Insurance – +5.3% (quarterly)
- Domestic travel – -15.5% over May (but was up 6.1% over April)
In the March 2023 quarter – Services annual inflation recorded its largest annual rise since 2001 is the real worry now for the reserve bank
This is related if you like to the fourth area of concern of rising inflation or CPI the stage where inflation can become entrenched and people expect prices to keep rising at the higher rate, this can lead to a wage price spiral and basically continuing to live in a world of higher than ideal rates of inflation.
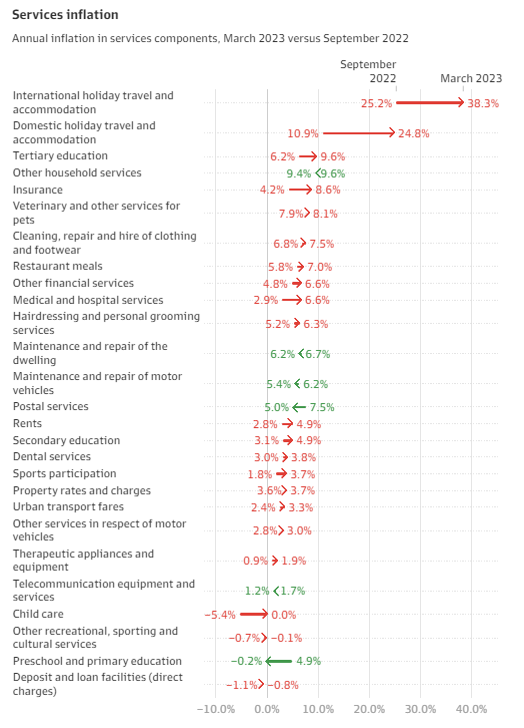
- Currently the high inflation is being driven by higher prices for holiday travel, medical services, rents and restaurant meals.
- It was 3% in March 2022
- 6.1% in March 2023
i. Rents – 6.3% annual change as of May 2023
ii. Holiday travel – 7.3% annual change as of May 2023
iii. Medical services – 5.8% annual change as of March 2023 (quarterly)
iv. Restaurant meals – 6.5% annual change as of March 2023 (quarterly)
- Annual inflation in restaurant meals hit 7 per cent in March, which is the fastest rate since the introduction of the GST in 2000. Ms Murphy said it reflected a combination of strong consumer demand and the pass-through of higher wages.
- “[Employers] are looking for chefs and they’re looking for wait staff. One of the ways that they can find them is by just by paying that little bit extra,”
- Annual inflation increased in 21 of the 27 services included in the CPI over the past six months, according to analysis by The Australian Financial Review.
- The largest price increases were recorded in the cost of going on a holiday, which has risen sharply as limited airline capacity has collided with soaring demand following the resumption of international travel.
- International holiday prices have increased by 38.3 per cent over the past year,
- while domestic holiday costs are up 24.8 per cent, according to the ABS.
- The next largest price increases were in tertiary education fees, followed by other household services like hiring a house cleaner or a gardener, which has increased by 9.4 per cent over the year.
- Annual inflation in the cost of going to the vet accelerated to 8.1 per cent in March, while the price of going to the dry cleaner was 7.5 per cent higher than 12 months ago.
- Insurance prices have increased by 8.6 per cent in the past 12 months thanks to higher house and motor vehicle policy premiums.
- Over the past six months, annual inflation has accelerated across almost every government-funded service, including medical and hospital services, secondary education fees, and property rates. In other words, either the governments are also getting in on the act and charging us more OR the providers of government services even though they receive funding or tax payers do for their services.
- Wages account for up to three-quarters of the cost of government-funded services such as childcare, education, and medical services, according to research by the RBA.
- Public sector wages have been running behind private sector wages for a long time, and that is going to even up a bit, which often means higher health prices and higher education prices
Why is services inflation a concern?
- Central banks globally are grappling with a shift in inflation away from goods and towards services, where prices are increasing because of resilient demand and a pick-up in wages growth.
- In the United States, services price inflation has remained little changed at very high levels for the past seven months, while there are also concerns about price pressures in the eurozone and the United Kingdom.
- Dr Lowe – It is possible that circumstances might be different here in Australia, but the experience abroad points to an upside risk, especially given the high degree of commonality across countries in inflation dynamics recently.
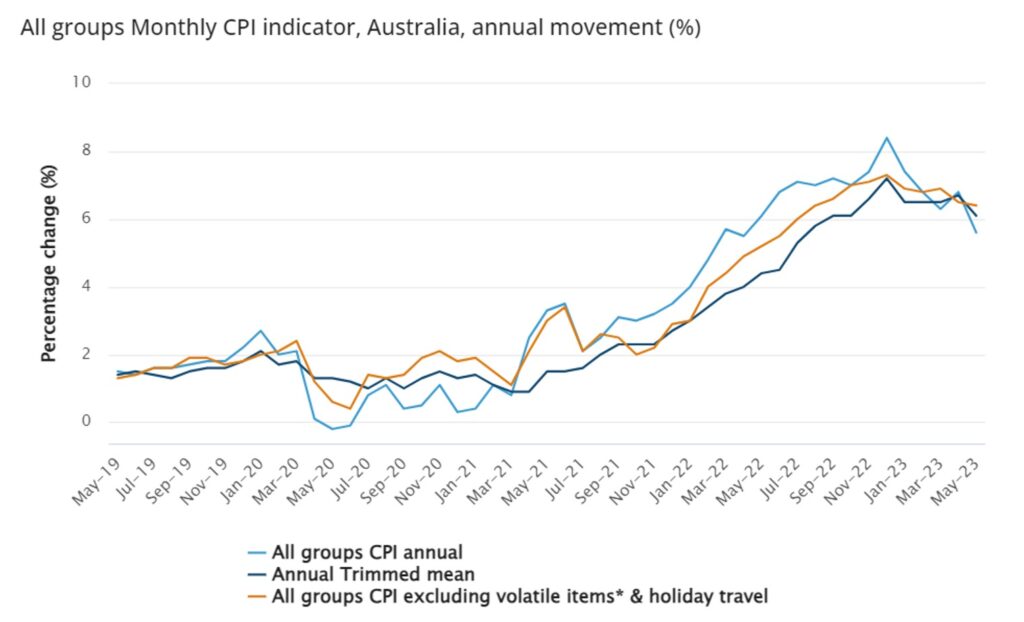
Here is a great chart we will share on the different trajectories of services V Goods.
5. What is the negative impact inflation has on the economy and individuals?
While moderate inflation is considered a normal feature of a healthy economy, high or hyperinflation can have adverse effects.
- It erodes the value of your savings relative to cost of goods, services or asset prices such as housing,
- reduces purchasing power because every dollar you earn is reducing in value relative to the prices of goods and services,
- distorts economic decision-making meaning governments and individuals start to make different, unusual or abnormal decisions,
- and this can create economic instability and lead to a reduce standard of living for the country citizens.
In next weeks episode in our series on Inflation and rising interest rates we will look at –
- Why central banks and governments often employ various measures, such as adjusting interest rates and implementing fiscal policies, to manage and control inflation within acceptable limits .
- What does the RBA keep an eye on to decide if they raise rates or not and why they are important such as household spending or consumption, the rate of unemployment sometimes referred to as labor markets, international economies, property prices, and productivity.
- Outcomes to the economy of rising rates
- Why the goal for wage growth is higher than that of inflation – spoiler alert, that means your income is growing faster than the cost of living.
- What are some of the impacts on the property market